| Nov 07, 2025 DeepSpaceDB: a spatial transcriptomics atlas for interactive in-depth analysis of tissues and tissue microenvironments |
DeepSpaceDB: a spatial transcriptomics atlas for interactive in-depth analysis of tissues and tissue microenvironments
Nucleic Acids Research, 2025 Oct 29 : gkaf1117.
https://doi.org/10.1093/nar/gkaf1117
Vladyslav Honcharuk1,2, Afeefa Zainab1, Yoshiya Horimoto3,4, Keiko Takemoto1, Diego Diez5, Shinpei Kawaoka1,6, Alexis Vandenbon*1,7,8
1 Institute for Life and Medical Sciences, Kyoto University
2 Department of Neuroscience, Graduate School of Medicine, Kyoto University
3 Department of Breast Surgery and Oncology, Tokyo Medical University Hospital
4 Department of Human Pathology, Juntendo University Faculty of Medicine
5 Immunology Frontier Research Center, Osaka University
6 Department of Integrative Bioanalytics, Institute of Development, Aging and Cancer (IDAC), Tohoku University
7 Institute for Liberal Arts and Sciences, Kyoto University
8 Department of Mammalian Regulatory Network, Graduate School of Biostudies, Kyoto University
*Corresponding Author
Abstract
In this study, we developed DeepSpaceDB (http://www.deepspacedb.com), a next-generation database for spatial transcriptomics. Spatial transcriptomics provides detailed maps of gene expression within tissues, revealing spatially organized cellular and molecular processes. However, data generation is costly, bioinformatic analysis is technically demanding, and existing public databases offer limited tools for interactive exploration.
DeepSpaceDB addresses these challenges by offering a high-quality, user-friendly platform centered on 10x Genomics Visium datasets. Unlike databases that emphasize broad platform coverage, DeepSpaceDB prioritizes analytical depth and interactivity. Users can flexibly explore spatial gene expression, compare multiple regions within a single sample, or examine differences between samples.
The platform provides quality metrics, database-wide overviews, and rich interactive visualizations including zoomable plots and on-hover information. Importantly, these tools are also available for user-uploaded Visium data, enabling customized analyses beyond the public dataset.
By integrating advanced analytics with intuitive interaction, DeepSpaceDB serves as a powerful resource for gaining deeper insight into tissue organization and disease biology.
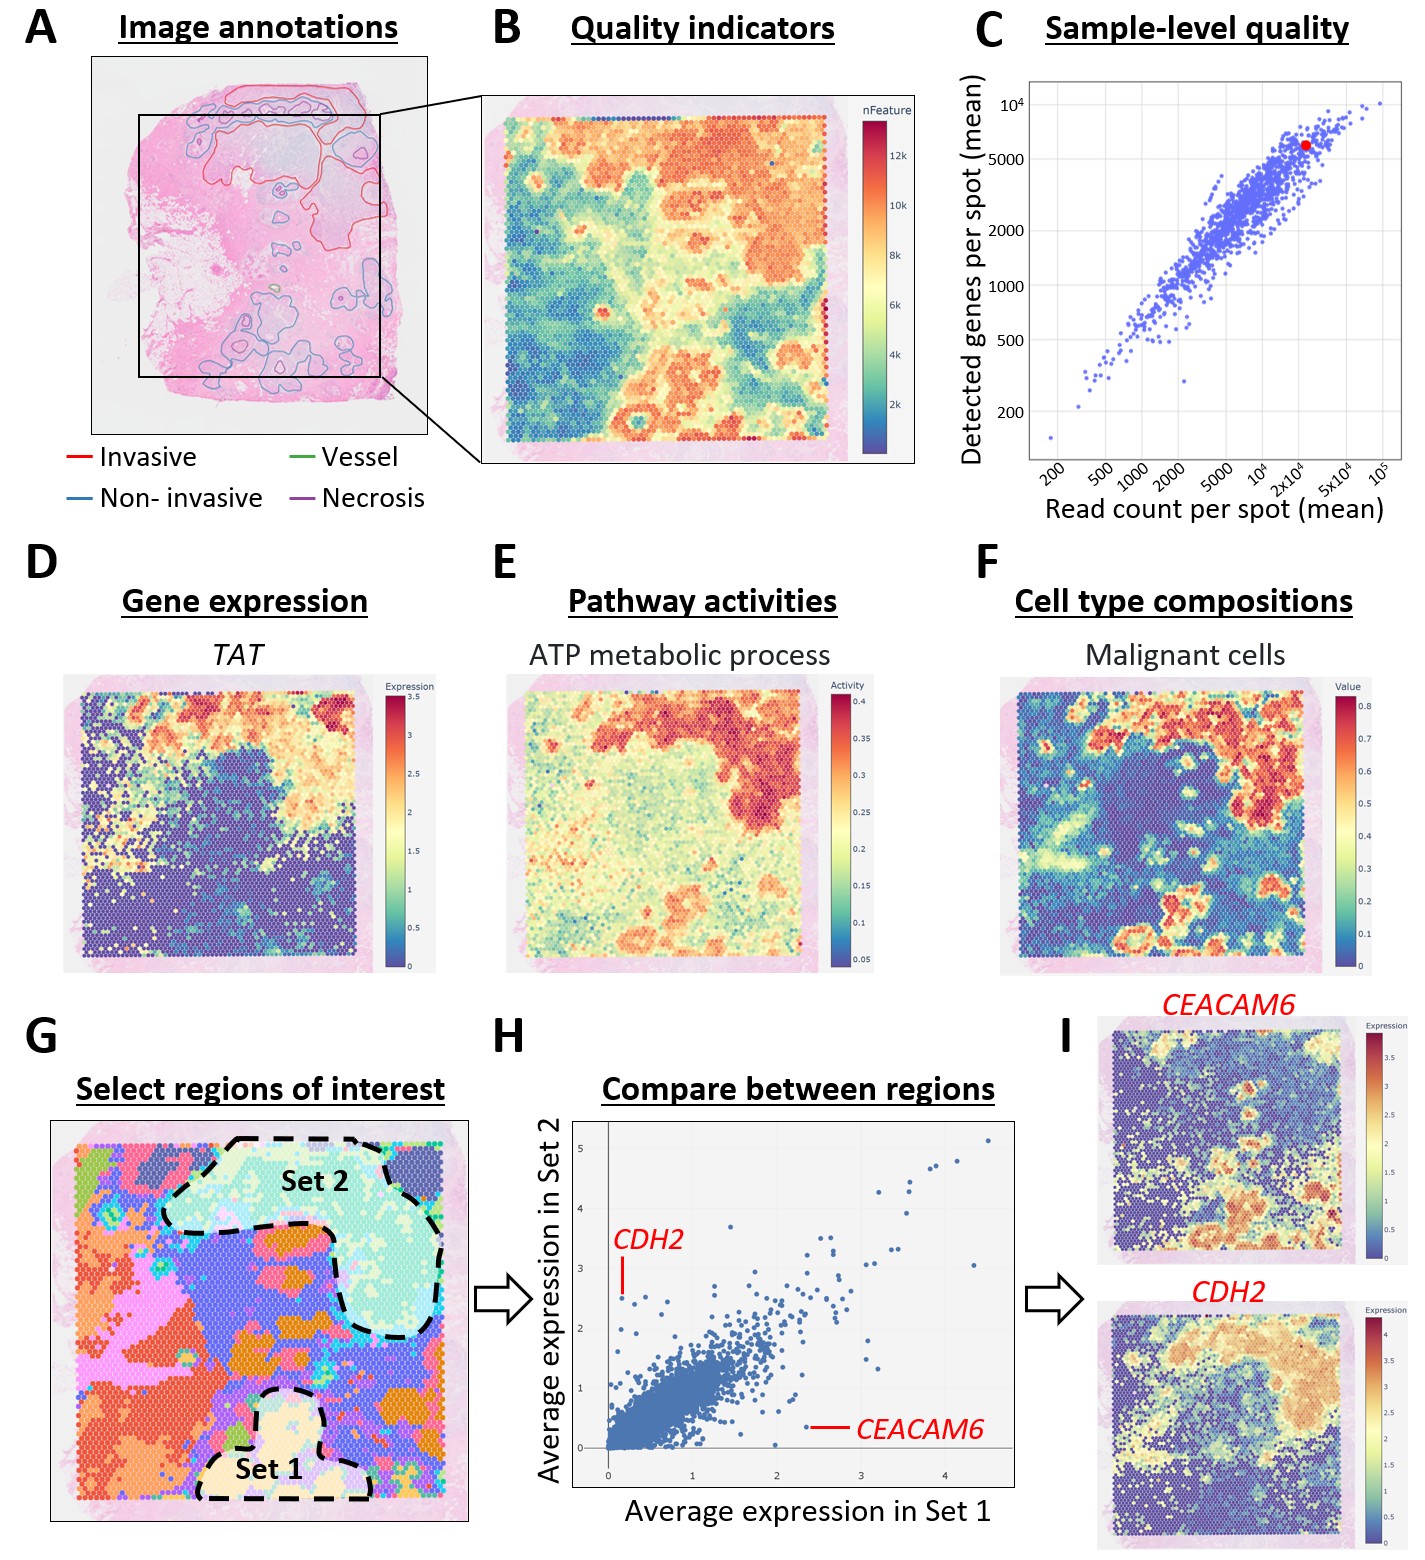
The figure below summarizes some of the features of DeepSpaceDB. (A) A subset of images have been annotated by a pathologist. (B) The quality of each slide can be inspected, including the number of detected genes per spot. (C) Quality can also be compared to all other samples in the database. (D-E) Gene expression patterns and pathway activities can easily be visualized. (F) Cell type compositions of all spots have been predicted. (G-H). Users can interactively select regions of interest and calculate the average gene expression within them. (I) Two genes with big differences between the selected regions, CEACAM6 and CDH2, are shown.